motif_plot
motif_plot.RdDraws multiple rounded rectangle.
Usage
motif_plot(
  motif_loc,
  gene_length,
  the_order = NULL,
  motif_select = NULL,
  shape = "RoundRect",
  show_motif_id = FALSE,
  r = 0.3,
  legend_size = 15,
  motif_color = NULL
)
Arguments
- motif_loc
A data.frame contains for columuns: ID, motif, start, end.
- gene_length
A data.fram of the length of biosequences. Two columns: ID, length.
- the_order
A List of Gene ID , One ID Per Line.
- motif_select
The motif ID which you want to align with.
- shape
RoundRect or Rect.
- show_motif_id
Display the name of the motif.
- r
The radius of rounded corners.
- legend_size
The size of legend.
- motif_color
The color set of motif.
Details
motif_plot() draws multiple rounded rectangle to represent the above elements of biosequences, but not limited to biosequences
Examples
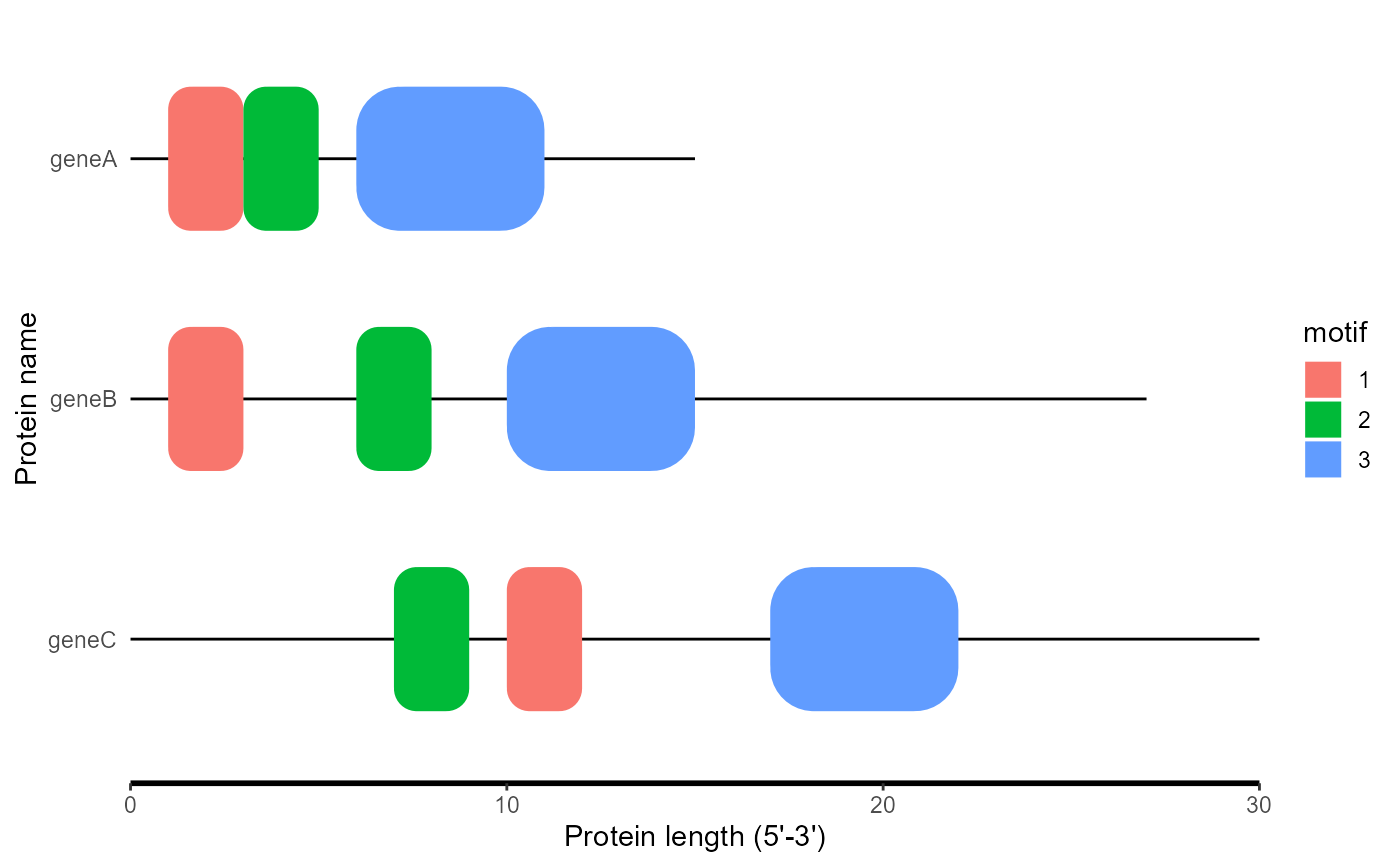
df <- data.frame(
ID = rep(c("geneA", "geneB", "geneC"), each = 3),
motif = rep(c("1", "2", "3"), times = 3),
start = c(1, 3, 6, 1, 6, 10, 10, 7, 17),
end = c(3, 5, 11, 3, 8, 15, 12, 9, 22)
)
length_data <- data.frame(
ID = c("geneA", "geneB", "geneC"),
length = c(15, 27, 30)
)
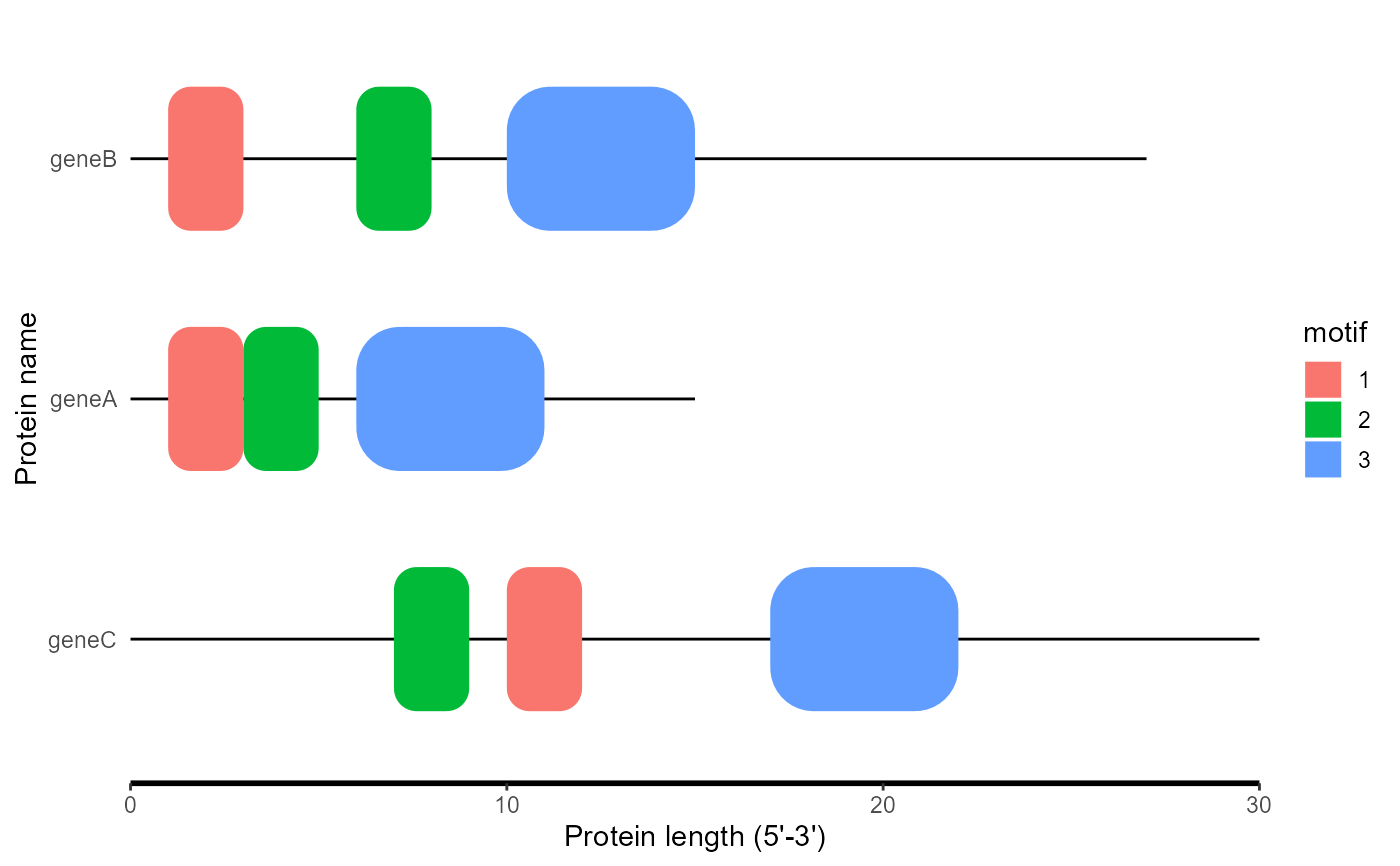
order_data <- c("geneB", "geneA", "geneC")
motif_plot(df, length_data)
 motif_plot(df, length_data, the_order = order_data)