cdd_plot
cdd_plot.RdVisualization of domain in CDD file
Usage
cdd_plot(
  cdd_file,
  fasta_file,
  the_order = NULL,
  domain_select = NULL,
  shape = "RoundRect",
  r = 0.3,
  legend_size = 15,
  domain_color = NULL
)
Arguments
- cdd_file
The path of cdd file.
- fasta_file
The path of fasta file.
- the_order
The path of order file. A List of Gene ID , One ID Per Line.
- domain_select
The domain ID which you want to align with.
- shape
RoundRect or Rect.
- r
The radius of rounded corners.
- legend_size
The size of legend.
- domain_color
The color set of domain.
Examples
hitdata_path <- system.file("extdata", "hitdata.txt", package = "BioVizSeq")
fa_path <- system.file("extdata", "idpep.fa", package = "BioVizSeq")
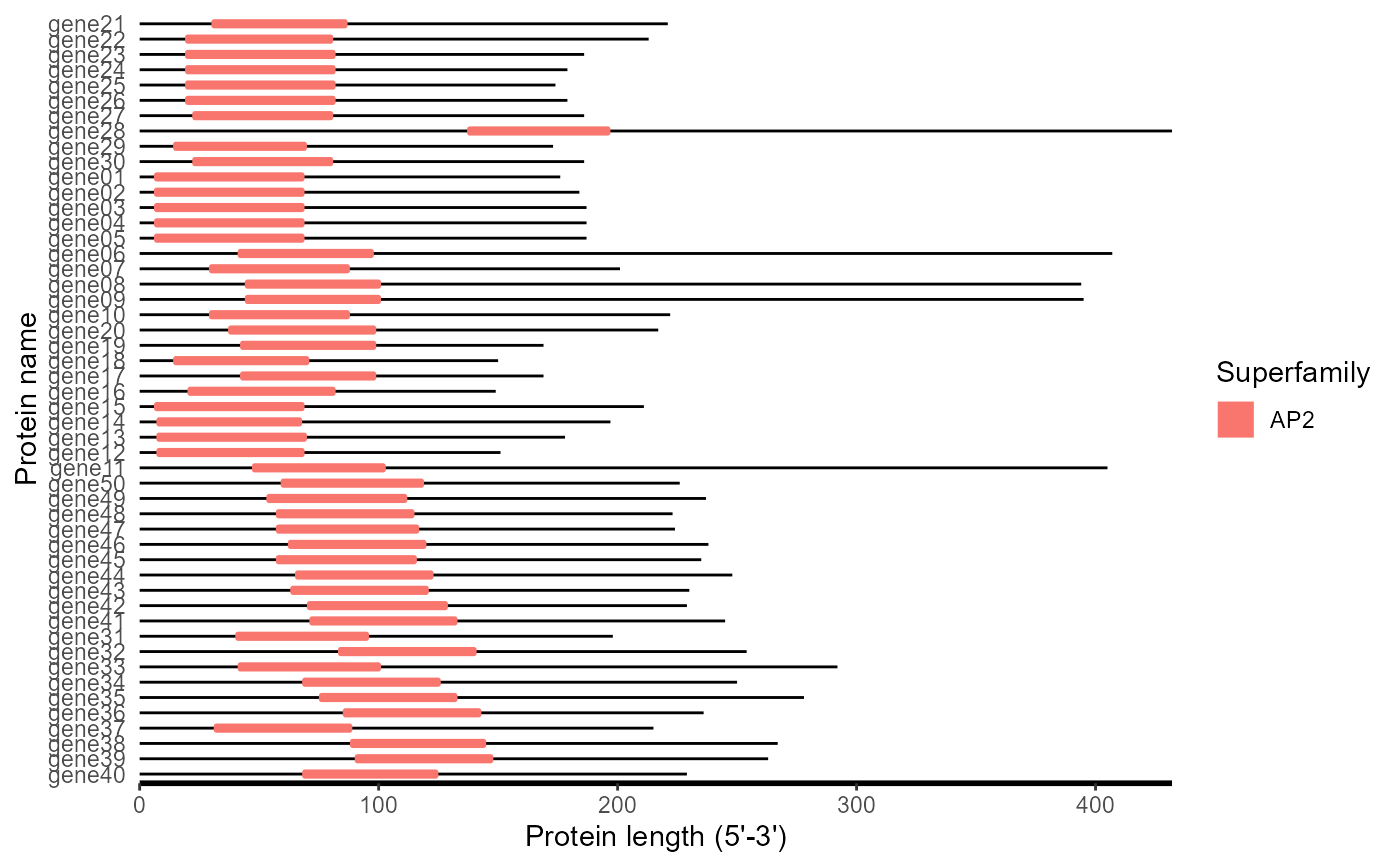
cdd_plot(hitdata_path, fa_path)
 order_path <- system.file("extdata", "order.csv", package = "BioVizSeq")
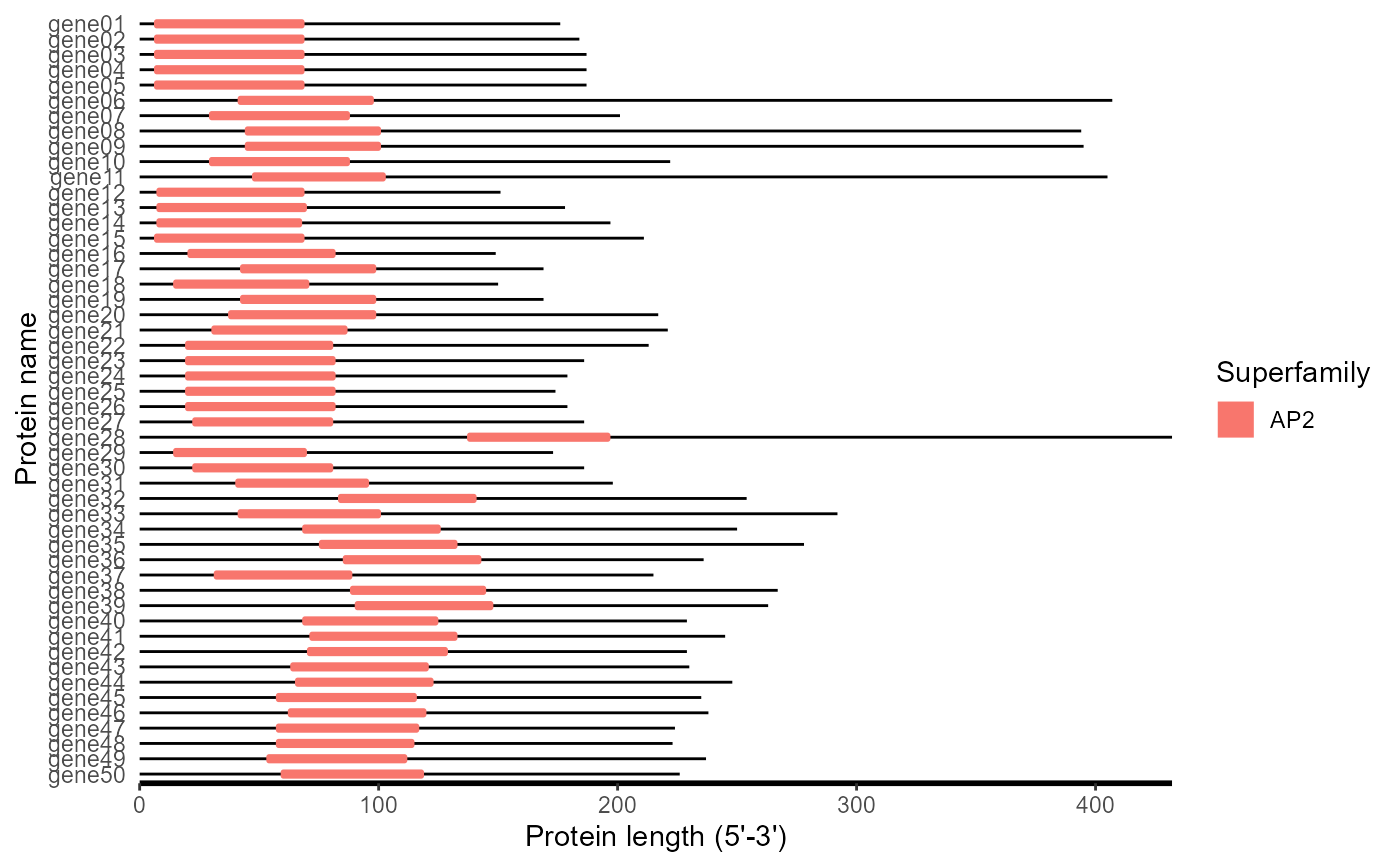
cdd_plot(hitdata_path, fa_path, the_order = order_path)
order_path <- system.file("extdata", "order.csv", package = "BioVizSeq")
cdd_plot(hitdata_path, fa_path, the_order = order_path)